In today’s digital landscape, monitoring and analyzing application logs is crucial for understanding system performance, debugging issues, and improving overall reliability. When working with Amazon ECS (Elastic Container Service), you can centralize your log management using the ELK stack—Elasticsearch, Logstash, and Kibana. In this comprehensive guide, we will walk you through setting up ECS logs for direct integration with Kibana using both the AWS Management Console and Terraform.
Understanding the ELK Stack and ECS Logs

What is the ELK Stack?
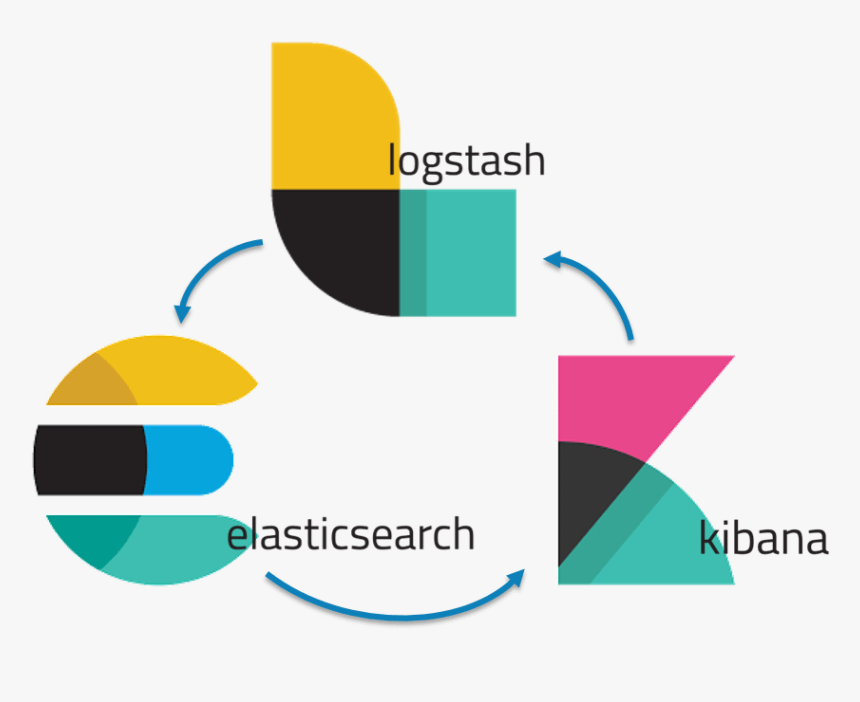
The ELK stack is a powerful open-source platform designed for searching, analyzing, and visualizing log data. It consists of:
- Elasticsearch: A distributed search and analytics engine for storing and querying logs.
- Logstash: A data processing pipeline that ingests, transforms, and forwards logs to Elasticsearch.
- Kibana: A visualization tool for exploring and analyzing data stored in Elasticsearch.
By integrating ECS logs with Kibana, you can monitor containerized applications effectively, troubleshoot issues in real-time, and gain actionable insights from your data.
Benefits of Centralizing Logs with Kibana
- Improved Visibility: Centralize logs from all ECS tasks for seamless monitoring.
- Powerful Analytics: Use Kibana’s dashboards to track performance trends and anomalies.
- Simplified Debugging: Quickly identify issues by querying logs with Elasticsearch.
- Scalability: Handle large volumes of logs without compromising performance.
Logging Options in ECS
Amazon ECS supports multiple logging drivers, including AWS CloudWatch Logs, Fluentd, and Splunk. To set up Kibana integration, we’ll use Fluent Bit, a lightweight log processor compatible with Elasticsearch.
Adding the ELK Stack to ECS
Setting Up the ELK Stack
Using AWS Console
- Elasticsearch Domain:
- Open the Amazon OpenSearch Service console and select Create domain.
- Choose a deployment type and configure the instance size, storage, and access policies.
- Enable a public access endpoint or restrict it to your VPC.
- Logstash:
- Deploy a Logstash instance in your VPC. Use an EC2 instance and install Logstash with the necessary plugins for Elasticsearch output.
- Configure a pipeline to receive logs from Fluent Bit and forward them to Elasticsearch.
- Kibana:
- Access the Kibana endpoint provided by OpenSearch Service.
- Set up your index patterns and start building dashboards.
Using Terraform
You can provision the ELK stack using Terraform. Here is an example script:
resource "aws_opensearch_domain" "elk" {
  domain_name           = "elk-stack"
  elasticsearch_version = "7.10"

  cluster_config {
    instance_type  = "m5.large.search"
    instance_count = 3
  }

  ebs_options {
    ebs_enabled = true
    volume_size = 20
  }

  access_policies = <<POLICY
{
  "Version": "2012-10-17",
  "Statement": [
    {
      "Effect": "Allow",
      "Principal": "*",
      "Action": "es:*",
      "Resource": "arn:aws:es:region:account-id:domain/elk-stack/*"
    }
  ]
}
POLICY
}

resource "aws_instance" "logstash" {
  ami           = "ami-12345678"
  instance_type = "t2.medium"
  user_data     = <<EOF
#!/bin/bash
sudo apt update && sudo apt install -y logstash
EOF
}
Run terraform apply to deploy the ELK stack resources.
Deploy Fluent Bit to ECS
Refer to the earlier section for detailed Fluent Bit configuration and deployment steps.
Also Read: What is Datadog?
Setting Up ECS Logs with Kibana (AWS Console and Terraform)
Configure the Elasticsearch Domain
Using AWS Console
- Open the Amazon OpenSearch Service console.
- Create a new domain by selecting Create domain.
- Choose a deployment type (e.g., Development and testing).
- Configure instance types and storage as needed.
- Enable a public access endpoint or restrict access to your VPC.
- Note down the Elasticsearch endpoint and Kibana URL.
Using Terraform
Here’s an example Terraform script to create an Elasticsearch domain:
resource "aws_opensearch_domain" "ecs_logging" {
  domain_name           = "ecs-logs-domain"
  elasticsearch_version = "7.10"

  cluster_config {
    instance_type = "t3.small.search"
    instance_count = 2
  }

  ebs_options {
    ebs_enabled = true
    volume_size = 10
  }

  access_policies = <<POLICY
{
  "Version": "2012-10-17",
  "Statement": [
    {
      "Effect": "Allow",
      "Principal": "*",
      "Action": "es:*",
      "Resource": "arn:aws:es:region:account-id:domain/ecs-logs-domain/*"
    }
  ]
}
POLICY
}
Run terraform apply to provision the domain.
Deploy Fluent Bit as a Sidecar in ECS
Using AWS Console
- Open the ECS console and select your cluster.
- Edit your task definition to add a Fluent Bit container.
- Use the official Fluent Bit image: fluent/fluent-bit:latest.
- Configure environment variables for Elasticsearch: FLUENT_ELASTICSEARCH_HOST=<Elasticsearch endpoint> FLUENT_ELASTICSEARCH_PORT=443 FLUENT_ELASTICSEARCH_TLS=true FLUENT_ELASTICSEARCH_USER=<username> FLUENT_ELASTICSEARCH_PASSWORD=<password>
- Mount the task’s log files to Fluent Bit using volumes.
- Update the logging configuration of your main container to send logs to the Fluent Bit sidecar.
Using Terraform
Here’s how to configure Fluent Bit in your ECS task definition:
resource "aws_ecs_task_definition" "ecs_task" {
  family                   = "ecs-logging-task"
  container_definitions = jsonencode([
    {
      "name": "app-container",
      "image": "<your-app-image>",
      "logConfiguration": {
        "logDriver": "awslogs",
        "options": {
          "awslogs-group": "/ecs/ecs-app-logs",
          "awslogs-region": "<region>",
          "awslogs-stream-prefix": "ecs"
        }
      }
    },
    {
      "name": "fluent-bit",
      "image": "fluent/fluent-bit:latest",
      "environment": [
        { "name": "FLUENT_ELASTICSEARCH_HOST", "value": "<Elasticsearch endpoint>" },
        { "name": "FLUENT_ELASTICSEARCH_PORT", "value": "443" },
        { "name": "FLUENT_ELASTICSEARCH_TLS", "value": "true" }
      ]
    }
  ])
}
Run terraform apply to update the ECS task definition.
Verify Logs in Kibana
- Open Kibana using the URL provided by your Elasticsearch domain.
- Create an index pattern matching your log index (e.g., ecs-logs-*).
- Use Kibana’s Discover tab to explore the ingested logs.
- Build custom dashboards for real-time monitoring and analytics.
Conclusion
By following this guide, you’ve set up a robust logging pipeline to centralize ECS logs in Kibana, leveraging the ELK stack’s capabilities. Whether you used the AWS Management Console or Terraform, this setup ensures scalable log management and visualization for your containerized workloads. With Kibana dashboards, you can gain valuable insights, enhance system reliability, and streamline debugging efforts.

