Datadog is a powerful cloud-based monitoring and analytics platform that provides comprehensive observability for modern IT environments. This blog post dives deep into Datadog’s capabilities, exploring how it unifies metrics, logs, and traces from across your entire technology stack. From its core features and integrations to real-world use cases and pricing considerations, we cover everything you need to know about this popular DevOps tool. Whether you’re a seasoned IT professional or just starting your journey in infrastructure monitoring, this guide will help you understand how Datadog can enhance your ability to detect issues, optimize performance, and make data-driven decisions. Discover why organizations of all sizes are turning to Datadog to gain real-time insights into their applications and infrastructure.
Understanding Datadog: Your Comprehensive Guide
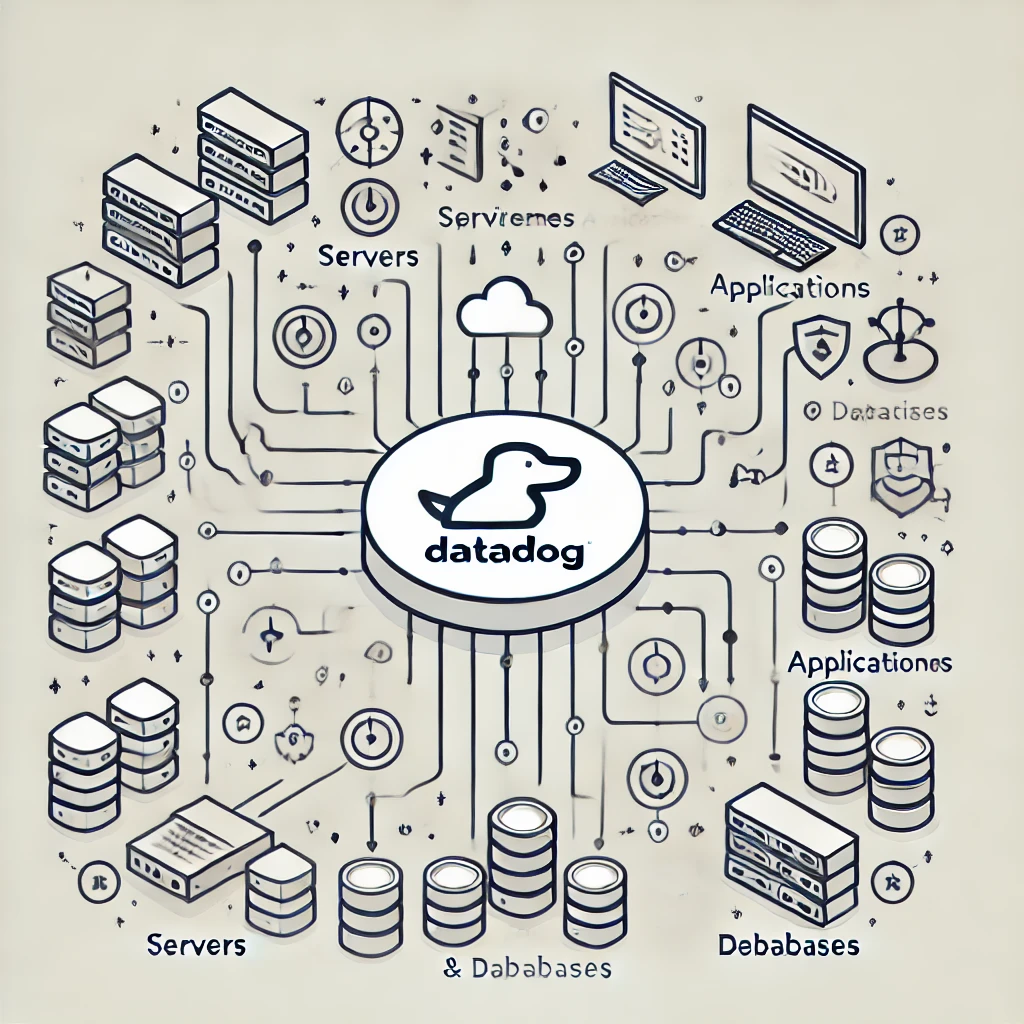
Datadog is a cloud-based monitoring and analytics platform designed to provide full-stack observability for modern applications and infrastructure. It offers a wide range of tools and services that help organizations gain insights into their IT systems, applications, and infrastructure performance. By aggregating data from various sources, Datadog enables teams to detect issues, optimize performance, and make data-driven decisions.
At its core, Datadog serves as a central hub for monitoring, troubleshooting, and optimizing the entire technology stack. It collects metrics, logs, and traces from various sources, including servers, databases, applications, and cloud services. This comprehensive approach allows organizations to have a holistic view of their IT ecosystem, making it easier to identify and resolve issues quickly.
Why Datadog? Exploring Its Core Capabilities
Datadog has gained popularity among DevOps teams, system administrators, and developers for several reasons:
- Unified Monitoring: Datadog brings together metrics, logs, and traces from various sources into a single platform, eliminating the need for multiple monitoring tools.
- Scalability: It’s designed to handle large-scale environments, making it suitable for both small startups and large enterprises.
- Cloud-Native: Datadog is built for modern, cloud-based architectures and can easily integrate with popular cloud providers and services.
- Real-Time Insights: The platform provides real-time visibility into system performance, allowing teams to respond quickly to issues.
- Customization: Users can create custom dashboards, alerts, and reports tailored to their specific needs.
- Collaboration: Datadog facilitates team collaboration by providing shared views and collaborative troubleshooting tools.
These core capabilities make Datadog an attractive choice for organizations looking to improve their monitoring and observability practices.
Key Features of Datadog: What Sets It Apart
Datadog offers a rich set of features that distinguish it from other monitoring solutions:
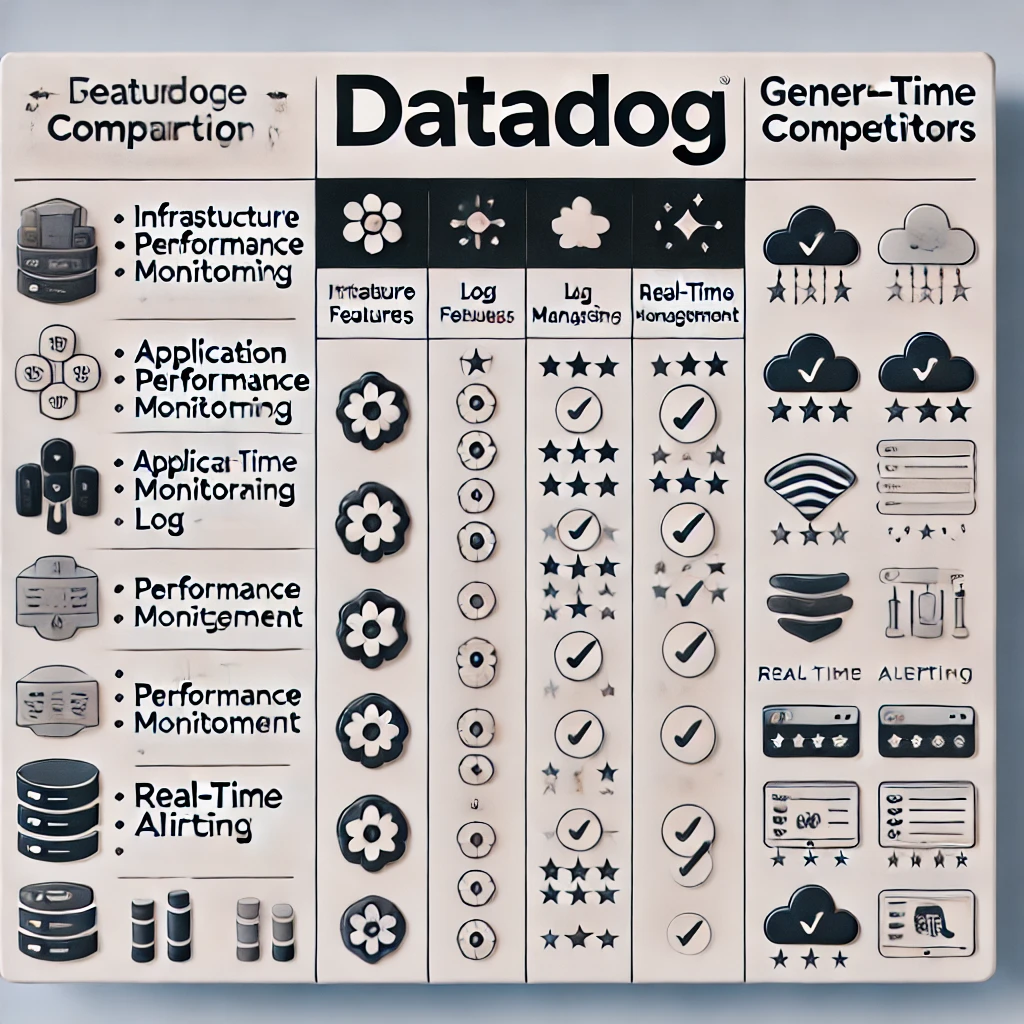
- Infrastructure Monitoring: Tracks the performance of servers, containers, and cloud services.
- Application Performance Monitoring (APM): Provides detailed insights into application behavior and performance.
- Log Management: Collects, processes, and analyzes logs from various sources.
- Network Performance Monitoring: Offers visibility into network flows and dependencies.
- Real User Monitoring (RUM): Tracks end-user experience and application performance from the client-side.
- Security Monitoring: Detects threats and anomalies across the entire stack.
- Synthetic Monitoring: Simulates user interactions to proactively identify issues.
- Continuous Profiler: Analyzes code-level performance across environments.
- Incident Management: Helps teams respond to and resolve issues efficiently.
These features work together to provide a comprehensive monitoring solution that covers all aspects of modern IT environments.
How Does Datadog Monitor Your Infrastructure?
Datadog employs a multi-faceted approach to monitor infrastructure:
- Agent-Based Monitoring: Lightweight agents installed on hosts collect detailed metrics and logs.
- Agentless Monitoring: For certain services, Datadog can collect data without requiring an agent installation.
- Cloud Integrations: Direct integrations with cloud providers allow for monitoring of cloud resources.
- API-Based Collection: Datadog’s API enables custom metric collection from any source.
- Service Discovery: Automatically detects and monitors new services as they come online.
- Container Monitoring: Provides visibility into containerized environments, including Kubernetes clusters.
This comprehensive approach ensures that no part of the infrastructure goes unmonitored, providing a complete picture of system health and performance.
Datadog Integrations: Connecting Your Ecosystem
One of Datadog’s strengths is its vast array of integrations, which allow it to connect with virtually any part of your technology stack. Some key integration categories include:
- Cloud Platforms: AWS, Azure, Google Cloud, and more.
- Databases: MySQL, PostgreSQL, MongoDB, Redis, and others.
- Web Servers: Apache, Nginx, IIS.
- Message Queues: RabbitMQ, Kafka, ActiveMQ.
- Containerization: Docker, Kubernetes, OpenShift.
- CI/CD Tools: Jenkins, GitLab, CircleCI.
- Logging Platforms: ELK Stack, Splunk, Sumo Logic.
- Application Frameworks: Node.js, Ruby on Rails, Django.
These integrations allow Datadog to collect data from various sources seamlessly, providing a unified view of your entire ecosystem.
Datadog for DevOps: Enhancing Team Collaboration
Datadog plays a crucial role in supporting DevOps practices by:
- Fostering Collaboration: Shared dashboards and alerts keep everyone on the same page.
- Improving Communication: Integrations with tools like Slack and PagerDuty streamline incident response.
- Accelerating Troubleshooting: Correlated metrics, logs, and traces speed up root cause analysis.
- Supporting Continuous Improvement: Historical data and performance insights drive optimization efforts.
- Facilitating Blameless Post-Mortems: Detailed timelines and event correlations aid in constructive incident reviews.
By providing a common platform for both development and operations teams, Datadog helps break down silos and promote a culture of shared responsibility.
Real-Time Monitoring with Datadog: How It Works
Datadog’s real-time monitoring capabilities are built on several key components:
- Data Collection: Agents and integrations continuously gather metrics, logs, and traces.
- Data Processing: Incoming data is processed, aggregated, and enriched in real-time.
- Anomaly Detection: Machine learning algorithms identify unusual patterns and potential issues.
- Visualization: Live dashboards update in real-time, reflecting the current state of systems.
- Alerting: Configurable alert conditions trigger notifications when thresholds are breached.
This real-time approach allows teams to detect and respond to issues as they occur, minimizing downtime and improving overall system reliability.
Using Datadog Dashboards: Visualizing Your Data
Datadog’s dashboards are powerful tools for visualizing complex data:
- Customizable Widgets: A wide range of visualization options, including graphs, heatmaps, and tables.
- Template Variables: Dynamic dashboards that adapt to different contexts and scopes.
- Correlation: Ability to overlay multiple metrics for easy comparison and correlation.
- Sharing and Collaboration: Dashboards can be shared with team members or embedded in other applications.
- TV Mode: Optimized view for display on large screens in operations centers.
Effective use of dashboards helps teams quickly grasp system status and identify trends or issues at a glance.
Datadog Alerts: Stay Ahead of System Issues
Datadog’s alerting system is designed to notify teams of potential problems before they impact users:
- Multi-Condition Alerts: Combine multiple metrics or logs in a single alert for complex scenarios.
- Anomaly Detection: Machine learning-based alerts that adapt to normal patterns in your data.
- Forecasting Alerts: Predict future metric values and alert on potential issues.
- Composite Alerts: Create alert hierarchies to reduce noise and focus on critical issues.
- Alert Integrations: Send notifications to various channels, including email, Slack, and PagerDuty.
Proper configuration of alerts is crucial for maintaining system reliability and reducing mean time to detection (MTTD) for issues.
Datadog Pricing: Is It Worth the Investment?
Datadog offers a tiered pricing model based on the features and scale of usage:
- Free Tier: Limited functionality for up to 5 hosts.
- Pro Plan: Full-featured monitoring with retention and custom metrics.
- Enterprise Plan: Advanced features, longer retention, and premium support.
While Datadog can represent a significant investment, especially for larger deployments, many organizations find the ROI compelling due to:
- Reduced downtime and faster issue resolution
- Improved team efficiency and collaboration
- Better capacity planning and resource optimization
- Enhanced customer experience through proactive monitoring
It’s important to carefully evaluate your monitoring needs and compare them with Datadog’s offerings to determine if it’s the right fit for your organization.
Getting Started with Datadog: A Step-by-Step Guide
To begin using Datadog:
- Sign Up: Create an account on the Datadog website.
- Install the Agent: Deploy the Datadog agent on your hosts or cloud instances.
- Configure Integrations: Set up integrations for your specific tech stack.
- Create Dashboards: Build custom dashboards to visualize your key metrics.
- Set Up Alerts: Configure alerts for critical thresholds and conditions.
- Explore APM: If applicable, set up Application Performance Monitoring.
- Onboard Your Team: Invite team members and set up appropriate access controls.
- Iterate and Optimize: Continuously refine your monitoring setup based on your evolving needs.
Starting with a focused approach and gradually expanding your use of Datadog’s features can help ensure a successful implementation.
Datadog in Action: Real-World Use Cases
Datadog is used across various industries and use cases:
- E-commerce: Monitoring website performance and user experience during high-traffic events.
- FinTech: Ensuring the reliability and security of financial transactions and data.
- SaaS Providers: Tracking application performance and usage across distributed systems.
- Media Streaming: Monitoring content delivery and user engagement in real-time.
- IoT Platforms: Aggregating and analyzing data from thousands of connected devices.
These use cases demonstrate Datadog’s versatility in addressing diverse monitoring needs across different sectors.
Datadog vs. Competitors: Which Monitoring Tool Is Right for You?
When comparing Datadog to other monitoring solutions, consider factors such as:
- Ease of Use: Datadog is known for its user-friendly interface and quick setup.
- Integration Ecosystem: Datadog offers a vast array of out-of-the-box integrations.
- Scalability: It handles large-scale deployments well but can be costly for very large environments.
- Feature Set: Datadog provides a comprehensive suite of monitoring tools, which may be overkill for simpler needs.
- Pricing Model: Datadog’s pricing can be complex and potentially expensive for large-scale usage.
Popular alternatives include New Relic, Prometheus with Grafana, and Elastic Observability. The right choice depends on your specific requirements, budget, and existing technology stack.
Optimizing Your Workflow with Datadog Automation
Datadog offers several automation features to streamline workflows:
- Automated Tagging: Dynamically apply tags based on metadata for easier filtering and grouping.
- Monitors as Code: Define and version control your alert configurations using tools like Terraform.
- API and CLI Tools: Automate repetitive tasks and integrate Datadog into your CI/CD pipelines.
- Webhooks: Trigger external actions based on Datadog events and alerts.
- Scheduled Reports: Automatically generate and distribute performance reports to stakeholders.
Leveraging these automation capabilities can significantly improve operational efficiency and ensure consistency in monitoring practices across your organization.
In conclusion, Datadog is a powerful and versatile monitoring platform that offers comprehensive observability for modern IT environments. Its wide range of features, extensive integration ecosystem, and focus on real-time insights make it a popular choice for organizations of all sizes. While it requires careful consideration in terms of cost and complexity, Datadog’s ability to provide a unified view of your entire technology stack can be invaluable in today’s fast-paced, cloud-native world.

